


- Accueil
- Dans le monde
- Nos directions régionales
- Asie du Sud-Est insulaire
- Actualités : Asie du Sud -Est insulaire
- Indonesia’s agricultural trade: balanced with Southeast Asia, contrasted with the rest of the world
Indonesia’s agricultural trade shows a good balance with Southeast Asia, but strong specialisation in imports or exports from and to other regions
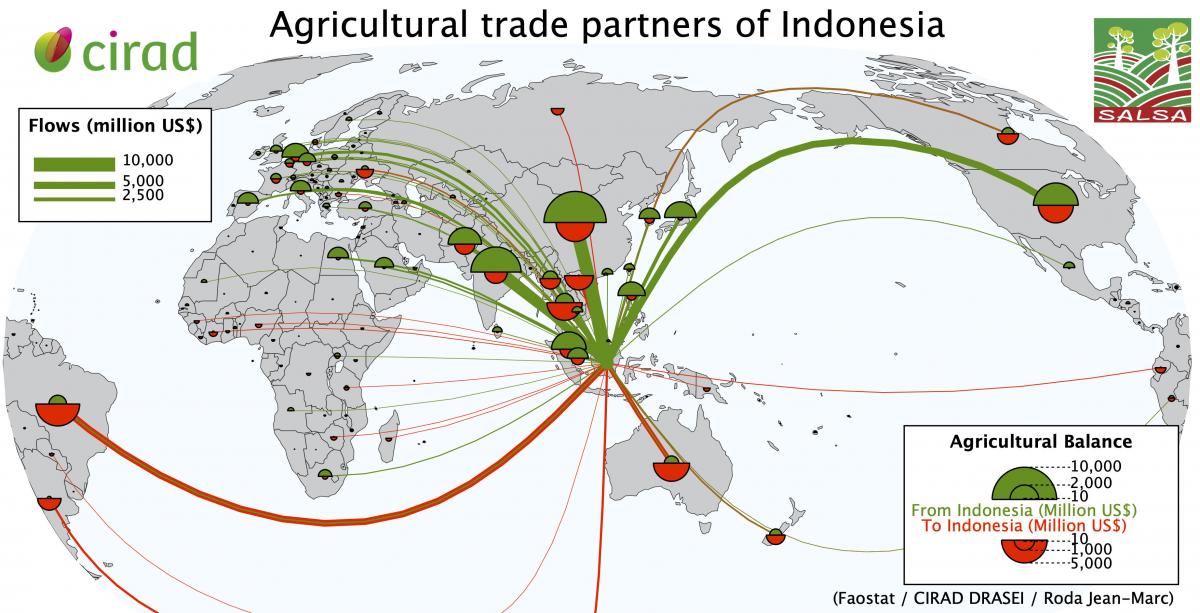
Agricultural trade partners of Indonesia (Economic map; © Roda Jean-Marc).
Overall, Indonesia shows an estimated agricultural trade surplus of about USD 15.3 billion. Exports are dominated by palm oil (USD 16.7 billion), industrial monocarboxylic fatty acids and acid oils (USD 5.6 billion), and natural rubber (USD 3.0 billion). Imports are led by rice (paddy equivalent + milled rice: USD 5.1 billion), wheat (USD 3.6 billion), and raw cane/beet sugar (USD 2.9 billion).
In details, two sub-regions stand out as quite ‘balanced’ in 2024 (difference within +/-5% of total bilateral trade): (i) South-eastern Asia, with both exports and imports of about USD 7.4 billion each (net balance: -13.3 million; -0.09%), and (ii) Sub-Saharan Africa, with both exports and imports of USD 0.9 billion each (net balance: -84.3 million; -4.66%). Within South-eastern Asia, Indonesia’s main export destinations include Malaysia (USD 2.9 billion) and the Philippines (USD 1.8 billion), while key import origins include Thailand (USD 3.0 billion) and Viet Nam (USD 2.0 million).
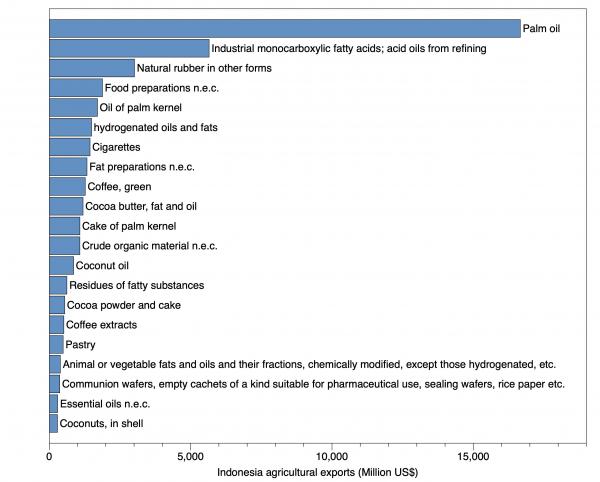
Indonesia main agricultural exports (Trade chart; © Roda Jean-Marc).
Other sub-regions are more specialised. Indonesia’s largest exports specialisations are to Eastern Asia (exports USD 13,3 billion vs imports USD 3,8 billion; surplus USD 9,5 billion) and to Southern Asia (surplus USD 6,7 billion). Conversely, the strongest import specialisations are from Latin America and the Caribbean (USD 5,1 billion) and from Australia and New Zealand (USD 3,1 billion). These patterns reflect Indonesia’s export specialization in palm-oil and rubber-based products, and import specialisation in cereals, sugar and feed ingredients.
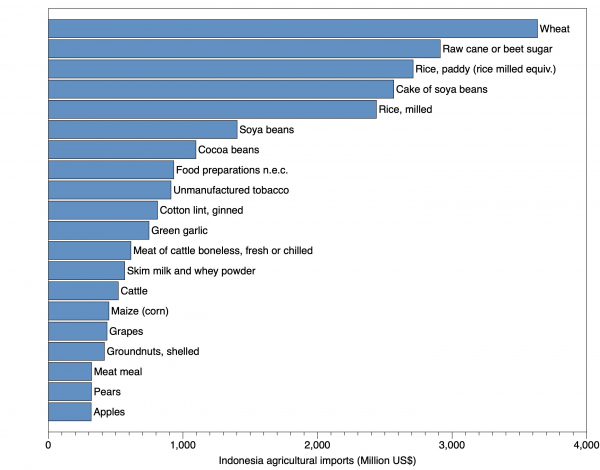
Indonesia main agricultural imports (Trade chart; © Roda Jean-Marc).
The good balance at the level of South-eastern Asia suggests deep regional integration and two-way agri-food value chains inside ASEAN, while large deficits with Australia-New Zealand and Latin America point to strategic South-South relationships for key staples and inputs (e.g., wheat, sugar, soybean products). Tracking these regional balances over time can help inform diversification strategies, food-security planning, and discussions on sustainable supply chains. This analysis was conducted using FAOSTAT’s ‘Detailed trade matrix’ for 2024 (import-export values, in thousand USD). We consolidated mirror-imports-export flows.